We’ve just wrapped up a month of polish, flow‑enhancement and productivity wins inside your SashiDo Dashboard. From build visibility to logs export, every update was driven by your feedback - because we know your time is precious and flow matters. No fluff. Just sharper tools so you can ship with confidence and less friction.
Let’s walk through what’s new.
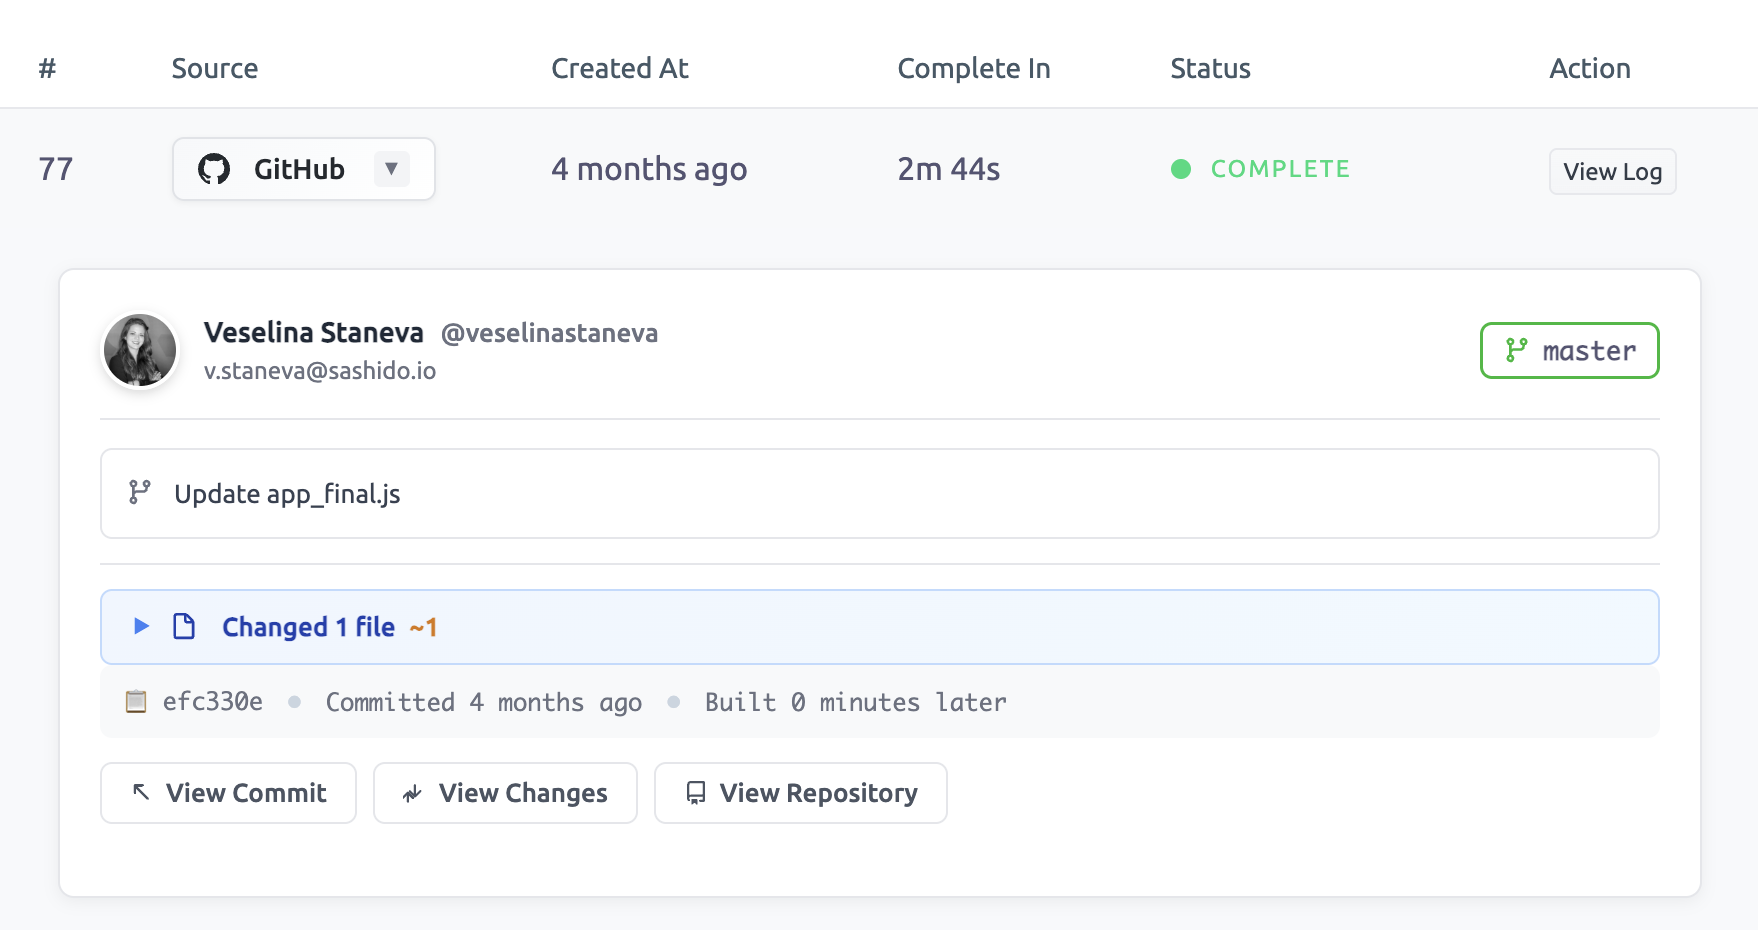
1. Builds: Visibility Upgrade
We kicked off the improvements with the Builds section so you have complete context for every build without leaving your SashiDo dashboard.
Here’s what we added:
- Full commit context inside each build: branch name badge, complete commit message, author avatar + name, list of files added/modified/removed and a direct link to GitHub.
- If a build includes multiple commits (e.g., a merge or a bulk update), you’ll now see each commit listed rather than just the latest.
- One‑click copy icons next to commit hashes so you don’t have to highlight manually.
- Smart filters for build status: All Builds / Running / Complete / Failed - each with a count badge for at‑a‑glance clarity.
- Auto‑expand the latest commit by default, assuming that’s most likely what you’re after.
- Some dev‑friendly touches: force‑push detection with warning; commit count badge; GitHub links everywhere; helpful empty‑state guidance for new users.
Why it matters:
When a build breaks, you don’t want to play detective. With this update you stay in context—branch, author, diff, commit history—all in your dashboard. Faster diagnosis, less tab‑hopping, quicker fixes. And when your team moves faster, your users notice.
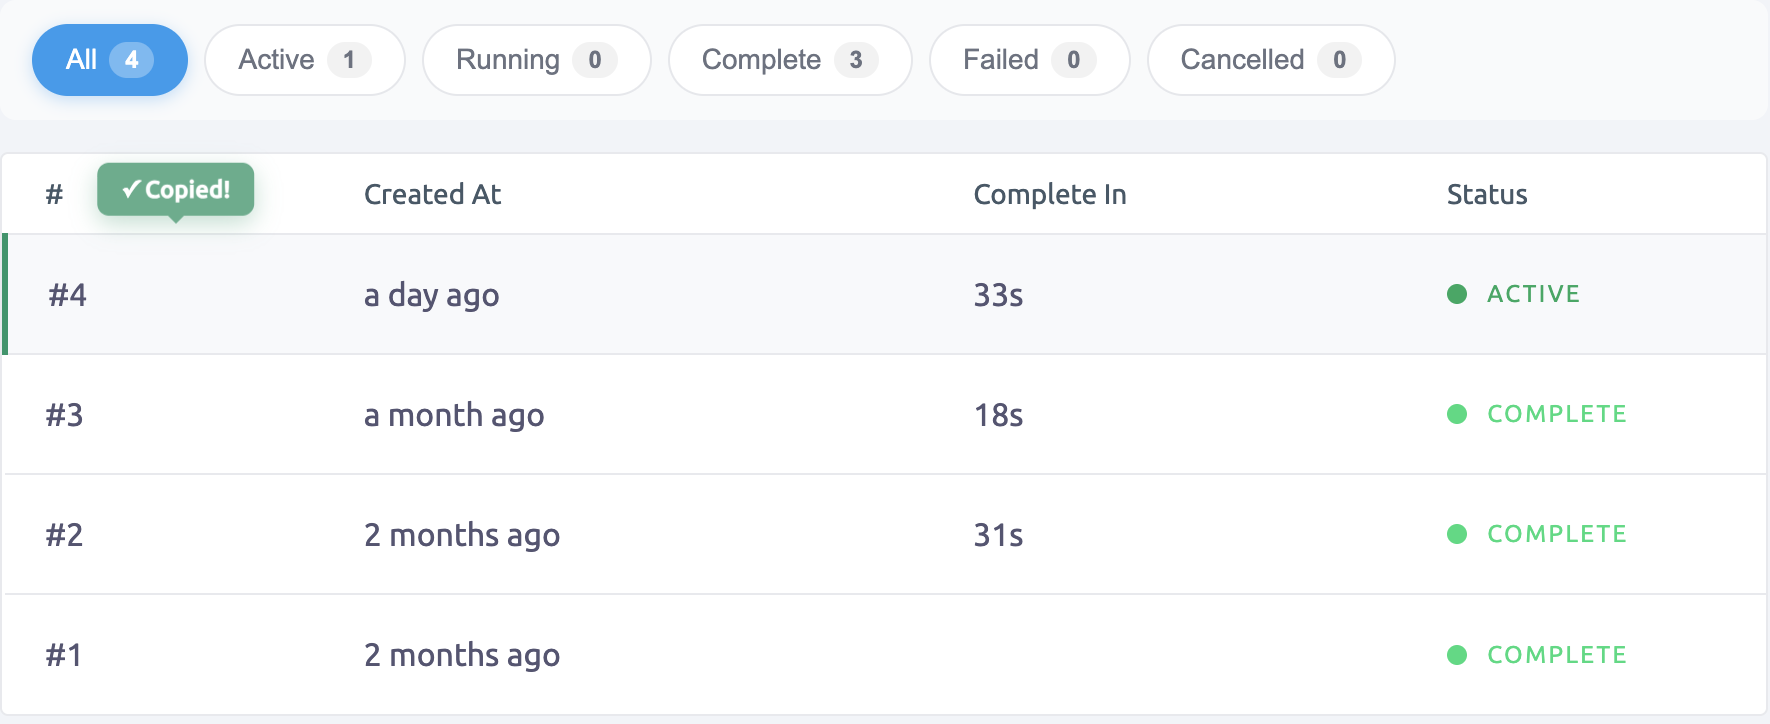
2. Deployments: Smarter Filters & UX Updates
Next in our sprint: your Deployments page got a refresh to help you move faster and stay in sync.
Here’s what changed:
- Status filters: Active, Running, Complete, Failed, Cancelled. Each filter shows a count (e.g., “Failed (2)”) so you immediately know where to focus.
- One‑click deployment number copy: Just click the deployment number and it copies to your clipboard—ready to paste into Slack, JIRA, terminal, etc.
- Green highlight for the active deployment: The deployment currently live in production is visually emphasized with a bright green border/background. Makes scanning quick.
Why it matters:
Deployments are high stakes. When things go wrong (or you just need to track what’s live), you need clarity and speed, not hunting through pages and timestamps. These tweaks remove friction so you can focus on what matters: shipping safe and fast.
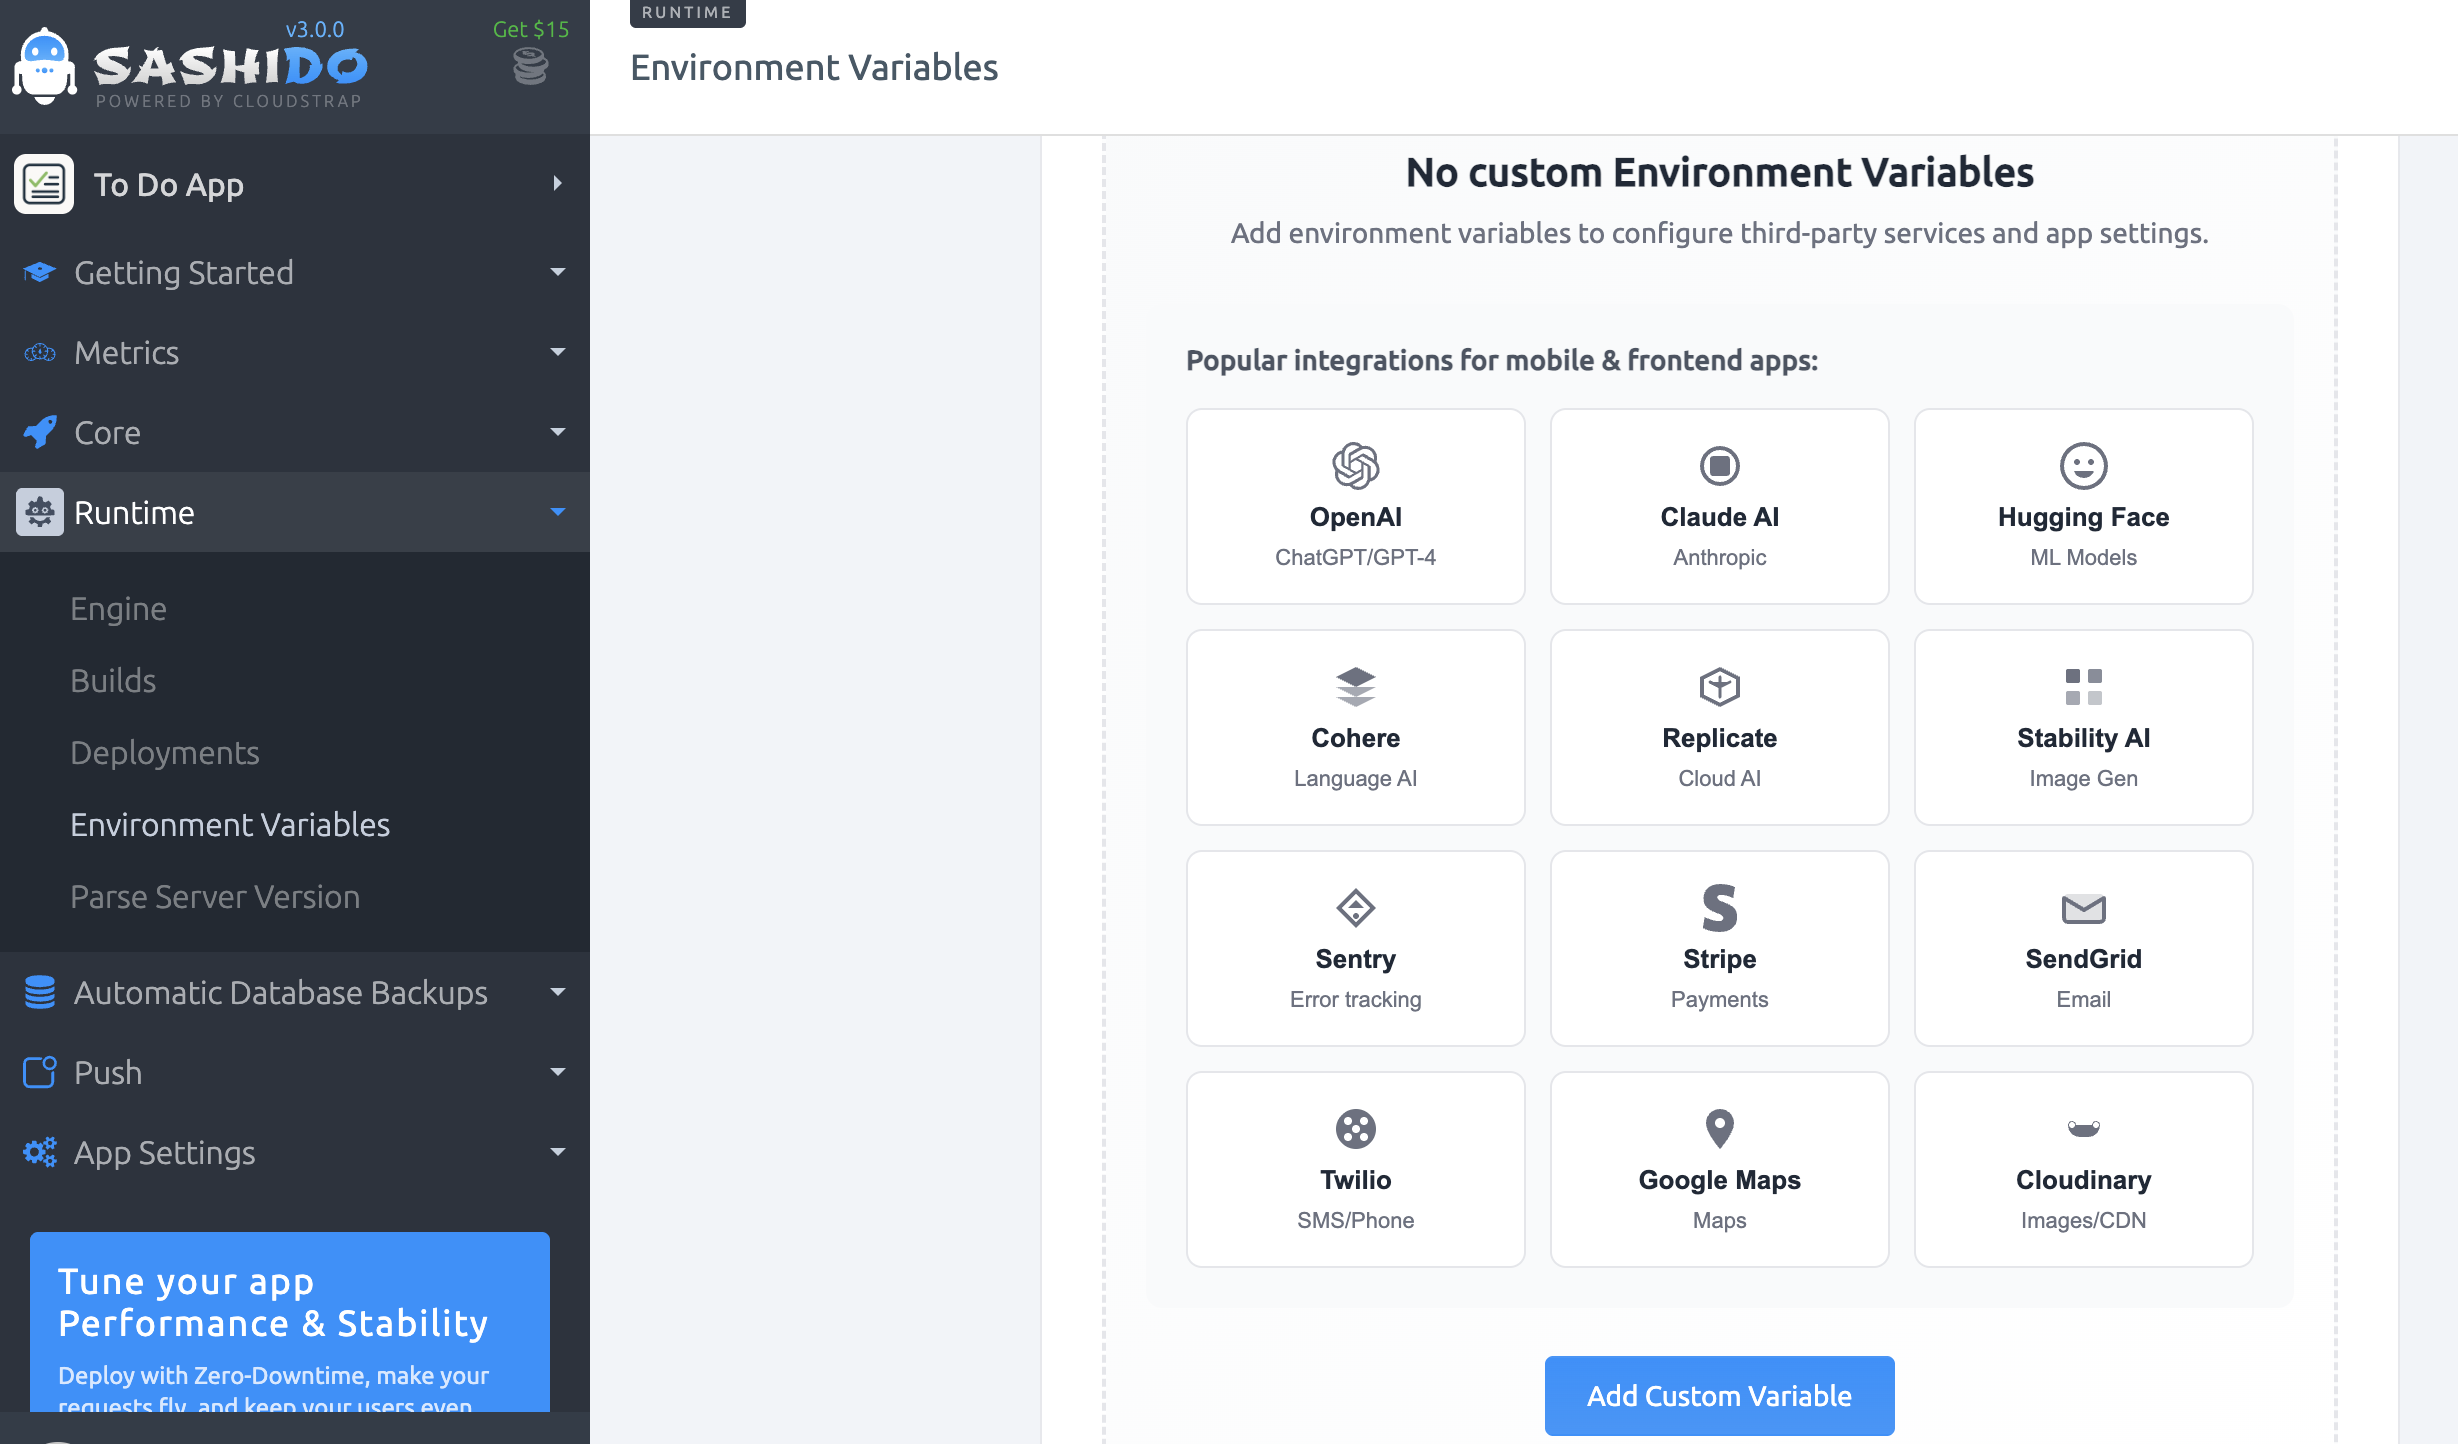
3. Environment Variables: One‑Click Examples
Third in our sequence: we improved how you set up and manage environment variables - a foundational but often pain‑point step.
Here’s the update:
- When you create a new environment variable, you’ll now see a grid of pre‑built examples for 12 of the most‑used services - from AI tools to payment systems.
- Examples include the correct variable name, an example format of the value, and copy‑to‑clipboard buttons. For services like:
- AI / LLMs: OpenAI (
OPENAI_API_KEY), Anthropic/Claude (ANTHROPIC_API_KEY), Hugging Face (HUGGINGFACE_API_KEY), Cohere (COHERE_API_KEY), Replicate (REPLICATE_API_TOKEN), Stability AI (STABILITY_API_KEY) - Core services: Stripe (
STRIPE_SECRET_KEY), Sentry (SENTRY_DSN), SendGrid (SENDGRID_API_KEY), Twilio (TWILIO_ACCOUNT_SID), Google Maps (GOOGLE_MAPS_API_KEY), Cloudinary (CLOUDINARY_URL)
- AI / LLMs: OpenAI (
- Setup now: Click the example → paste your key → Save & Deploy. No guesswork on naming or value formats.
Why it matters:
Onboarding a new integration shouldn’t feel like a scavenger hunt. Developers were losing time deciding what to name variables, what format to use, etc. With this release, you’re guided from start to deploy in ~30 seconds. Fewer errors, fewer Slack threads about “why isn’t this var named correctly?”, and faster iteration.
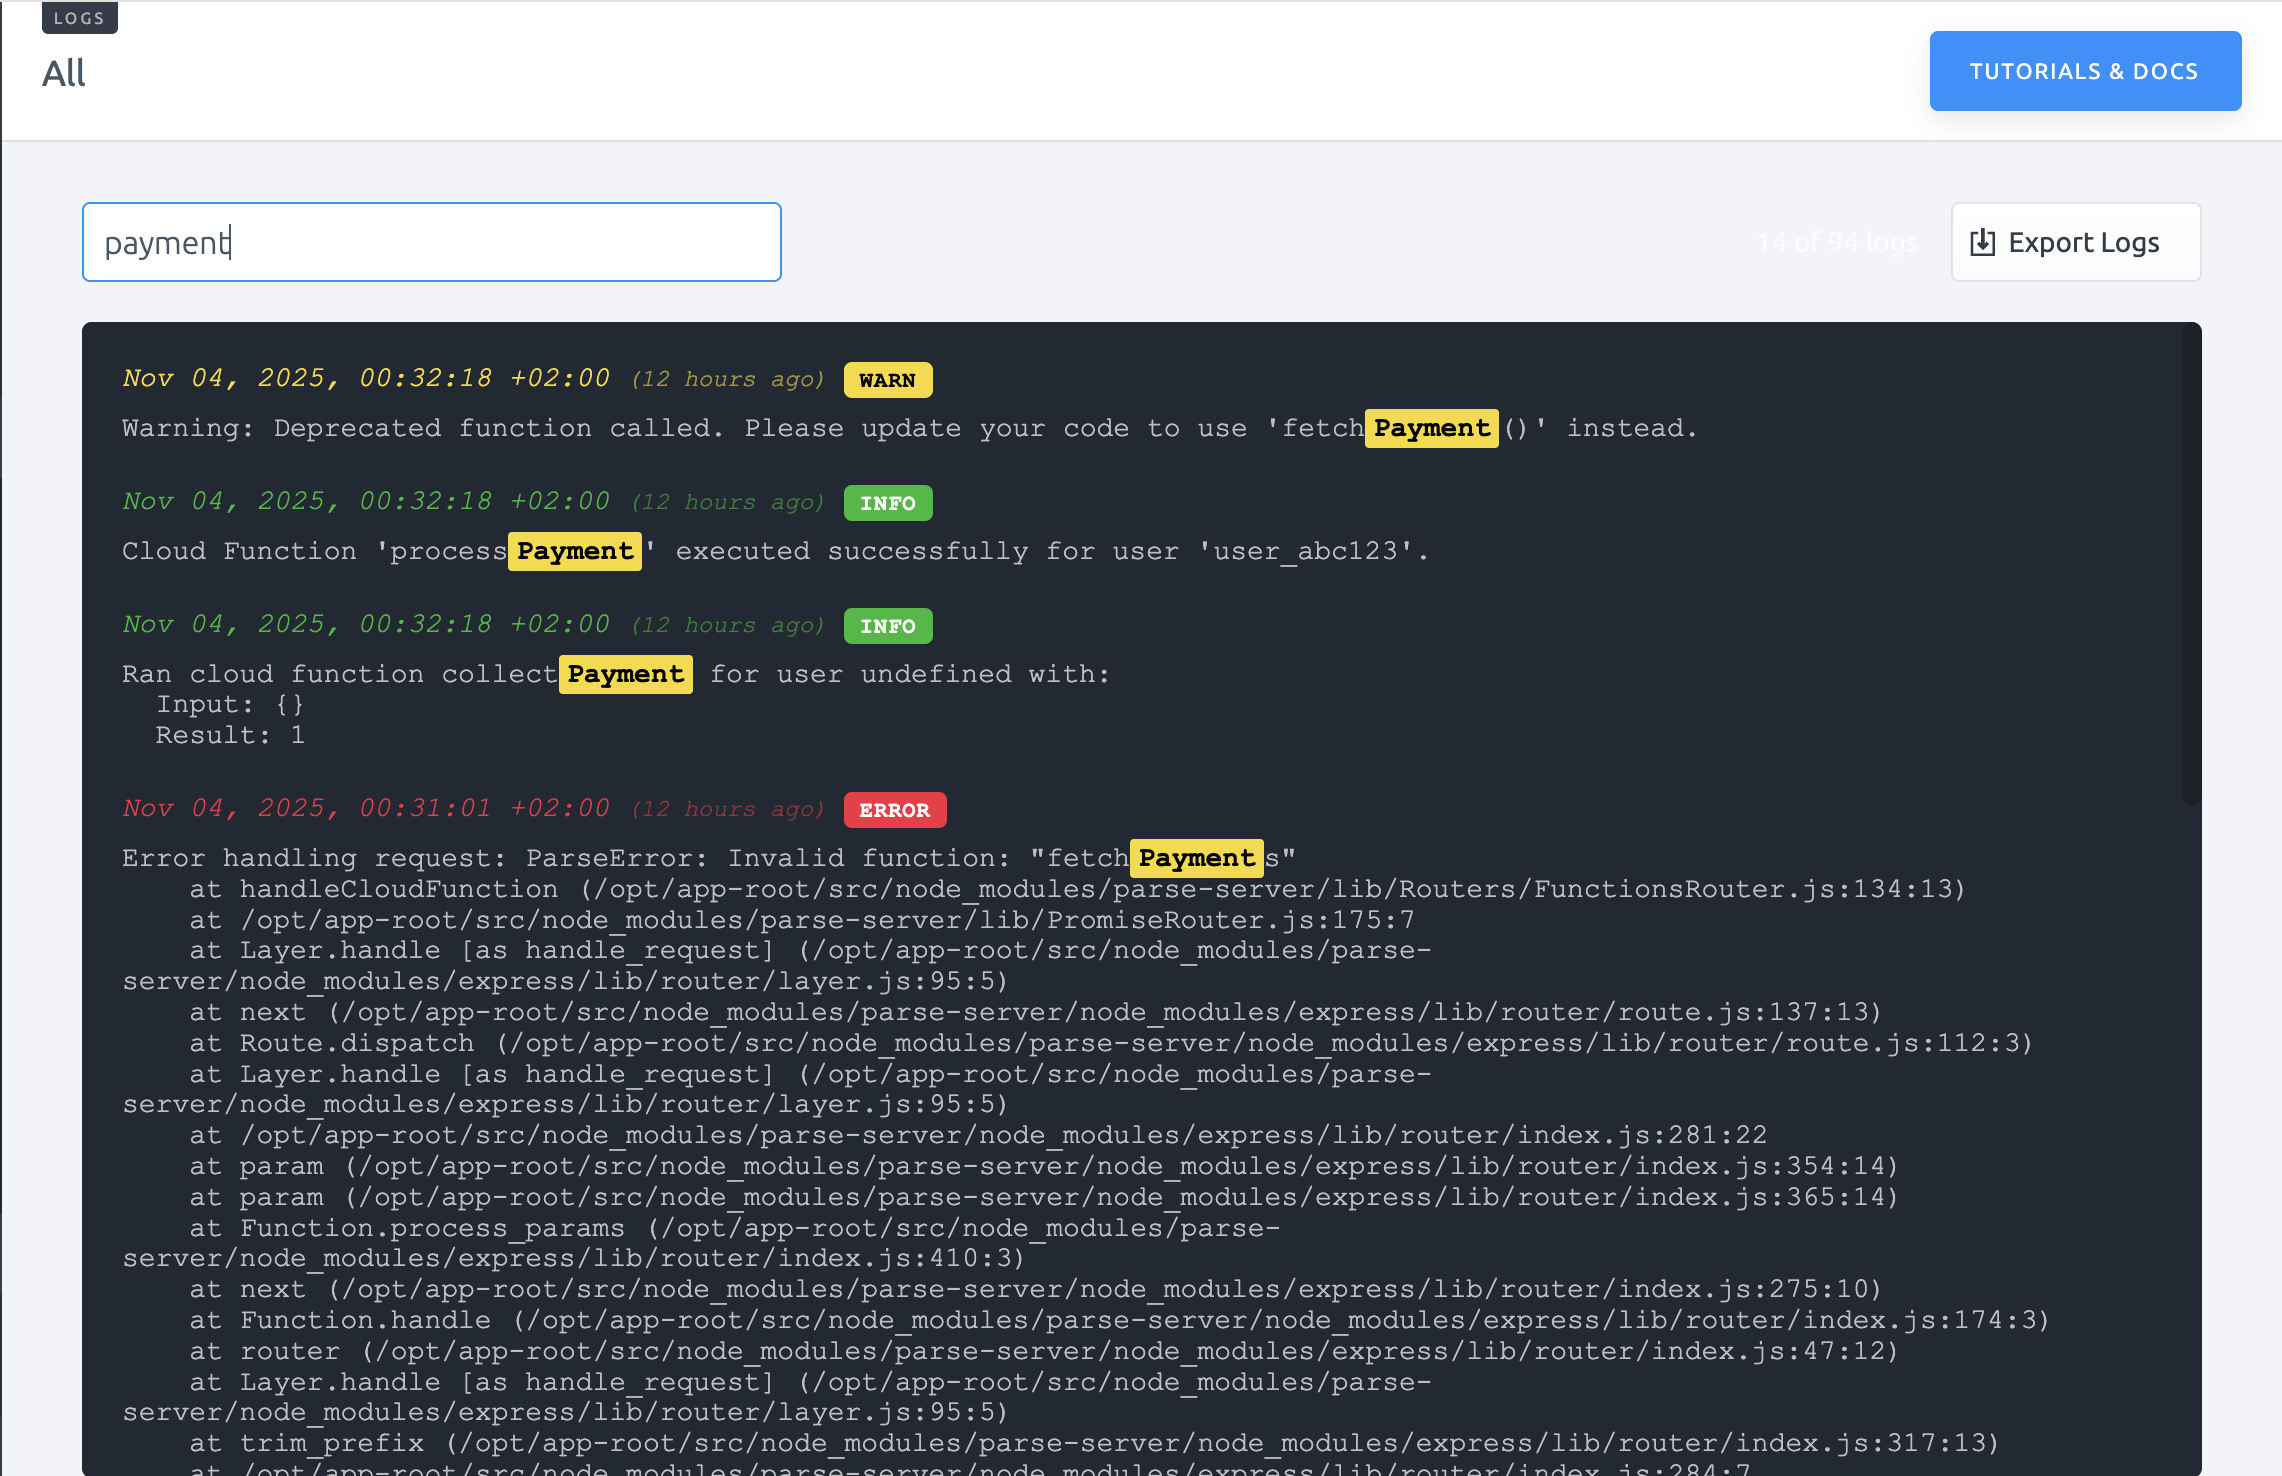
4. Logs: Search, Export & Copy for Fast Debugging
Finally, we wrapped the month of releases by tackling one of the biggest developer pain‑points: digging through logs.
Here are the key features:
- Instant search with highlighting: As you type in the search bar, results appear immediately across all log entries (messages, stack traces, metadata). Matches are highlighted in yellow for quick scanning.
- One‑click copy on each log line: Hover over a log line, click the copy icon, and the full entry is copied in tidy format. No screenshot, no manual formatting.
- Log export: Click “Export Logs” to get a clean .txt file of what’s currently visible. Auto‑generated filename helps with communication or compliance.
- Timestamps: relative + absolute: Logs now show both relative time (e.g., “5 days ago”) and the full absolute timestamp (e.g., “17:29:20 +02:00 on Oct 29, 2025”).
- Color‑coded badges: Log entries are tagged visually with badges: INFO (green), WARN (yellow), ERROR (red) — so your eyes land on what matters.
Why it matters:
When an incident hits - say, “payment failed around 3pm” - you don’t want to scroll endlessly or alt‑tab between tabs. These improvements let you identify the error, copy it, export if needed, and share in very fast. Minutes turn into seconds; frustration turns into fix momentum.
Wrapping Up
We shipped 20+ improvements this month across the SashiDo Dashboard - each one targeting a specific developer pain point: build visibility, deployment clarity, environment‑setup friction, and log debugging speed.

Here’s what that means for you:
- Less time hunting for context, more time shipping features.
- Fewer clicks, fewer tabs, fewer cognitive overheads.
- More consistent workflows across your team - onboarding, debugging, deployment.
- Real‑world wins: faster issue resolution, smoother releases, lower downtime.
What’s next?
We’re not done. This month’s sprint is part of a larger effort to make your SashiDo Dashboard work the way you do. We’d love to hear what’s slowing you down next - hit us at support@sashido.io with your feedback and ideas.
Log in now, fire up your dashboard, and check out the updates.
Happy Coding!