Welcome to Week 2 of our Dashboard Improvements Series. Last week we've covered what's new in Builds section. This time, we’re leveling up Deployments - with upgrades designed to help your team move faster, stay in sync, and debug with confidence.
No more scrolling and searching. No more manual copy + pasting. Just clarity, speed, and flow.
Deployment Debugging - Less Searching. More Solving.
The issue wasn’t lack of information – it was how long it took to reach the part you actually needed.
Previously, if something failed, you’d have to scroll through a long list of deployments, scan timestamps, try to remember the status, and manually grab the deployment number to share with a teammate.
That might not sound like much. But when you're troubleshooting under pressure or collaborating on a fix, every extra step chips away at your focus.
What we built isn’t just cleaner UI, it’s real UX improvement. All designed to help you move faster, stay in sync, and get to the root of issues without the mental overhead.
What We Built
Your deployments page now makes it immediately obvious what's happening – no detective work required.
Status Filters
Find exactly what you're looking for in one click:
- Active - what's live right now
- Running - deployments in progress
- Complete - successful deployments
- Failed - need investigation
- Cancelled - manually stopped
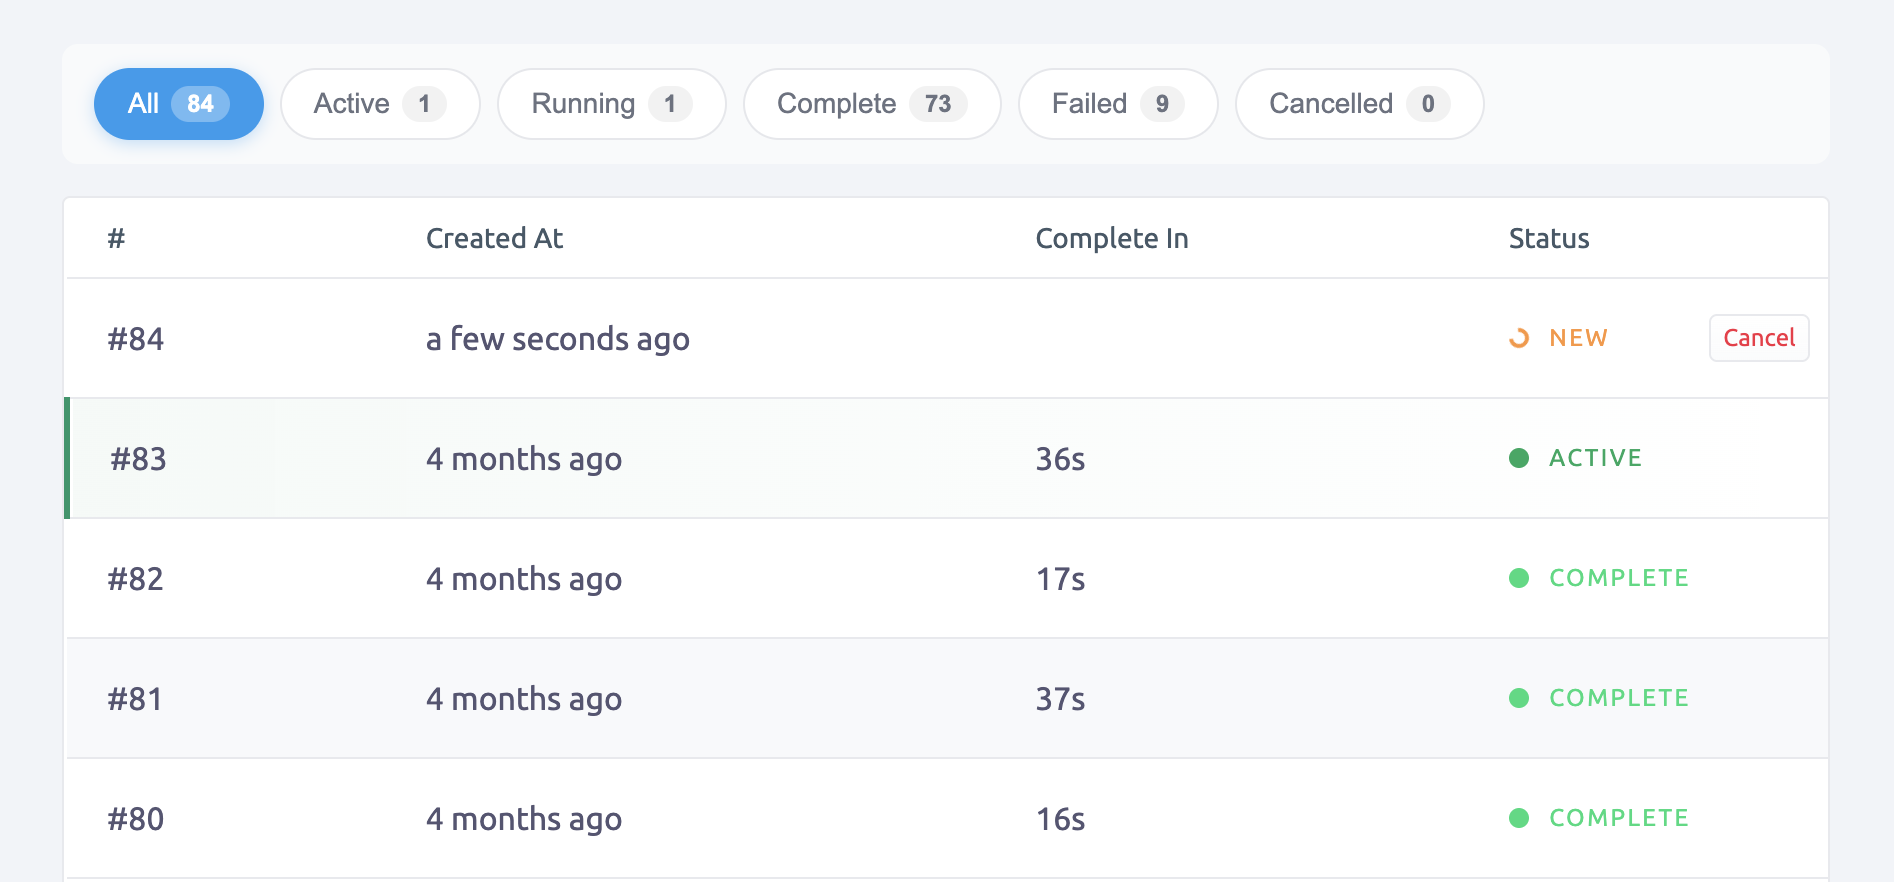
Each filter shows a count, like "Failed (2)" so you know what needs attention.
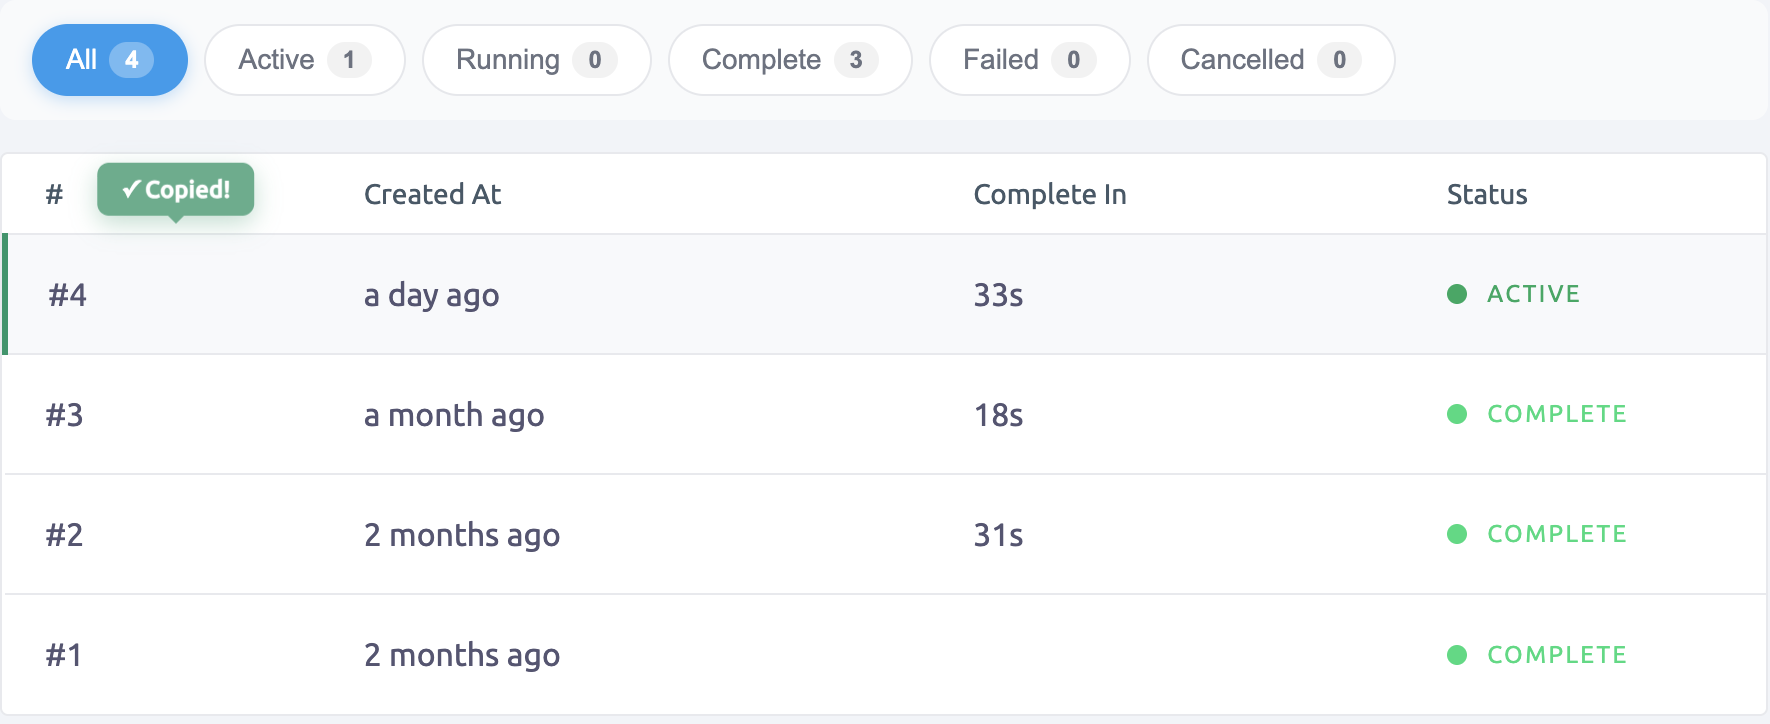
One-Click Deployment Numbers
Let’s say someone on your team asks about a deployment from yesterday. You don’t need to highlight anything manually.
Just find the deployment, click the number, and it’s copied to your clipboard. Clean. Fast. Ready to paste into Slack, a ticket, or your terminal.
"Deployment #4" is now one tap away from your clipboard.
Green Highlight for Active Deployment
No more squinting at timestamps.The deployment currently running in production gets a bright green border and background. Easy to spot at a glance.
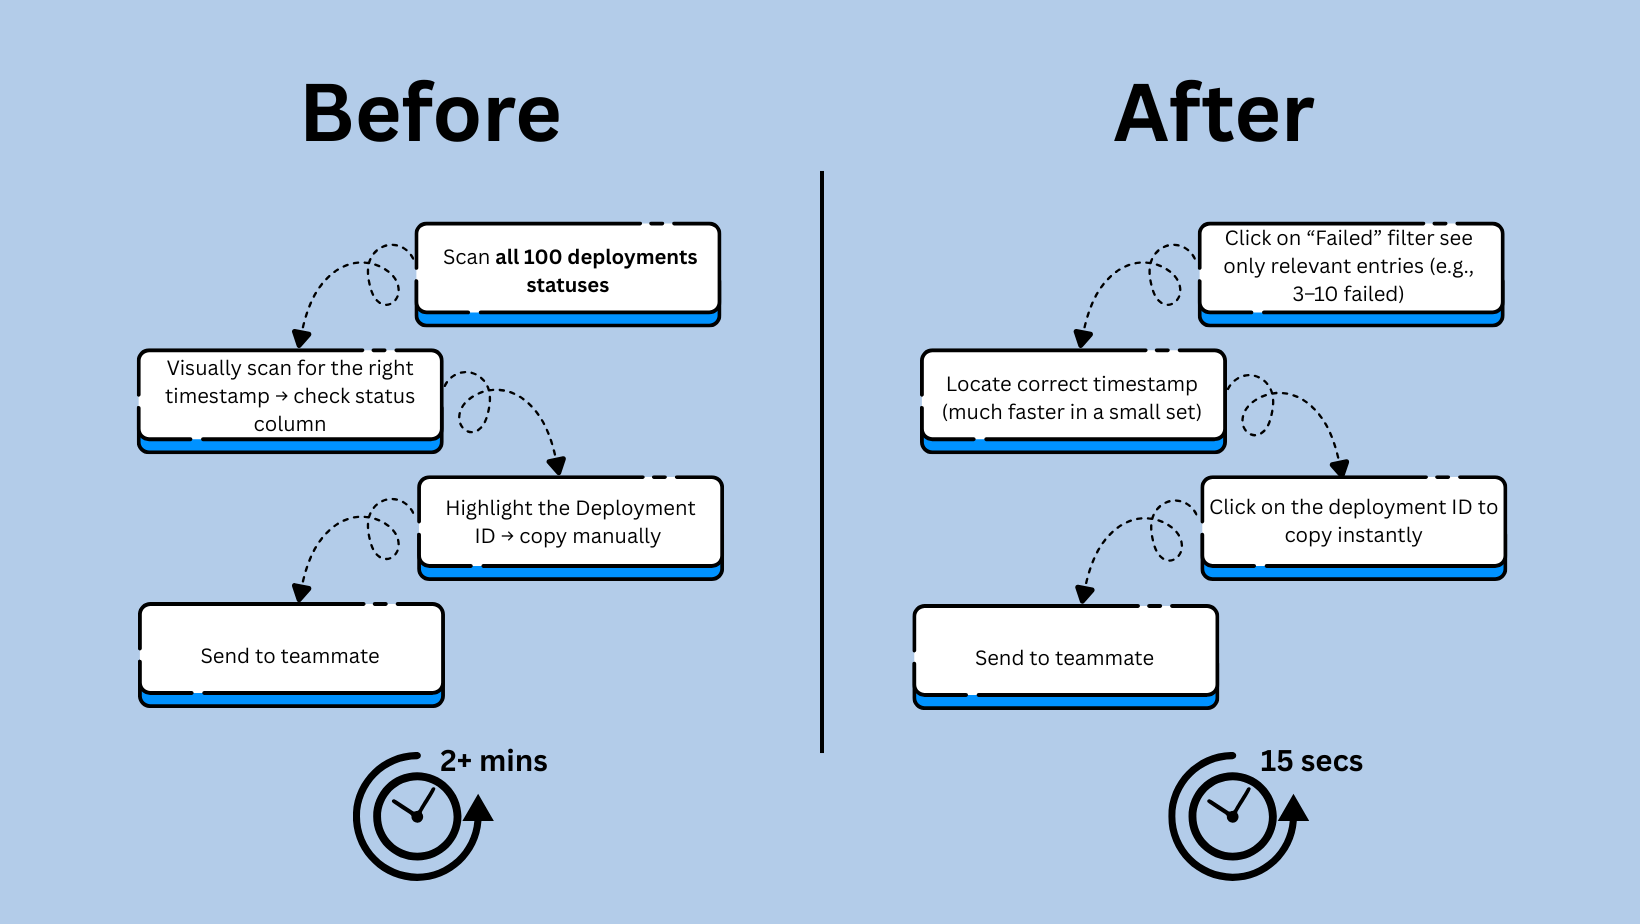
Workflow improvment and Speed Boost Example
We not only removed some steps and saved you time, but improved your everyday worflow. Let's take for example a situation where a customer reports an issue and a teammate is asking you for the specific number of the deployment that Faild 10 days ago and you have more than a 100 deployments.
Why This Matters
Your workflow is faster. You spend less time scanning for info and more time solving real problems. When something goes wrong, you’re not lost in the UI - you’re in control.
And faster debugging means quicker fixes. That means less downtime, fewer issues lingering in production, and a smoother experience for your customers.
And last, but not least - clearer deploy visibility leads to better coordination, fewer delays during incidents, and shorter time-to-resolution. That means happier teams, happier users, and fewer costly mistakes.
Try It Now
These upgrades are already live for all SashiDo users. No config. No billing changes. Just log in and go to Runtime > Deployments.
💡 Want more tips on managing your runtime efficiently? Check out our guide on tracking builds and deployments.
What’s Next?
This is part of a bigger effort to make your entire SashiDo dashboard more helpful. Over the next few weeks, we'll be sharing updates to Environment Variables and Logs. Each one solves a real problem we heard from you, so we'd love your feedback!
Got feedback? Questions? Ideas?
Ping us in chat or email us at support@sashido.io.
Not using SashiDo yet?
We’re a serverless backend built on Parse Server. No vendor lock-in. No credit card. And a real-human support team that actually responds.
Happy Coding!